Skip to content
  • Home
  • Services
  • JCTCS
  • KTS News and Development
  • Technology Dictionary
  • Phi Theta Kappa

Kornrumpf Technology Services

Learning to improve the security of computational surfaces.
  • Home
  • Services
  • JCTCS
  • KTS News and Development
  • Technology Dictionary
  • Phi Theta Kappa

Kornrumpf Technology Services

Learning to improve the security of computational surfaces.
  • Home
  • Services
  • JCTCS
  • KTS News and Development
  • Technology Dictionary
  • Phi Theta Kappa
Services

Blog 9: Microsoft Defender OR Avast Anti-Virus?

Lions, Tigers, and Malware – Oh! My.

Windows 10 Home comes with a built in Anti-Virus software called Windows Security. It does a good job of categorizing security concerns
into 7 unique categories:
1. Virus and Threat Protection, where you can place your folder systems into a protected state. This Anti-Virus software
also have a threat scanner. It even recently picked up the installer for The NiceHash Crypto Miner. (I’ll be covering that program at a later point!)
2. Account Protection, to prevent unauthorized users from accessing your desktop through: facial recognition, fingerprinting, pins, a
physical security key, passwords, and picture passwords! Talk about defense in depth.
3. Firewall and Network Protection, allows a brief over-view of the current state of the machines built in firewalls. Where
inbound connections that are NOT allowed are blocked, and outbound connections that ARE allowed pass.
4. Application and browser control, helps to provide safe browsing, and many different exploits. (The browsing protection appears to be limited to Edge users.)
5. Device security, with – core isolation, the TPM module, and secure boot features.
6. Device performance and health, to give a brief overview of the machines – storage, battery, application, and Windows service performance.
7. Family options, in order to protect against explicit websites (see our other solution – link), establish screen time habits,
generate an activity report, and control buying.

In comparison, and perhaps unnecessarily, Avast Anti-Virus– offers….a powerful virus scanner to find malware that slips in, as well as
to check for unsafe configurations, and passwords. The Anti-virus detects and block viruses, malware, spyware, ransomware, and phishing.
A Wi-Fi inspector to detect others on your network. One additional free feature is the “online security” browser extension.
Other than the Wi-Fi inspector, the free software doesn’t appear to add any additional features – and additionally, I’m blaming an Avast update
that got pushed back in 2020 for causing my laptop to crash. After that update to the program, I lost lots of data that I had been gathering for several years…. though maybe not forever. While it is not possible at this point of my technical knowledge to prove this, but it was the last software I interfaced with PRIOR to the crash – maybe they can help me recover the data to prove otherwise?

One strong positive for is the blog and community form, that – and the “threat search” portion of the blog particularly are,
in my estimation superior to the huge and often time confusing array of documents on the Microsoft website.

Overall, without paying, both lack many live support options! We also may attempt to review some of the source code in the future to determine what’s really happening on the net!


ktsmobil
2
Services

Blog 8: KTS Mobile Vision and Computing History

Getting ‘Back to the drawing board’ exists as a proverbial English idiom for failure, but more than that it’s carries the idea of hope, of new ideas, new creation – in the capital world, it means taking that which is old, and making it better, faster, cheaper.

Gathering a clear picture of the order of this old board, starts with a few notes on computing history, as an answer to how our world got here. Then with a question, “Who is in the business of creating computing machines, their components, building blocks, elements, and factors?”

In my time, co
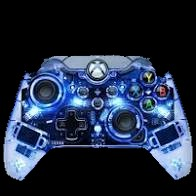
mputers have made an indelible impact in the halls of my mind. From the early virus infections of Windows 2000 to the terminally slow connection to DSL modems – fighting digitally for bandwidth. The red, yellow, and white inputs of some system generating tremendous playable audio and video; the brightest blue LED controller! All an enigmas black box created so delicately, working so perfectly that often the mind would be lost in the experience. Yet, there were points when this machine or that component would show flaws: a non-working disc, the loss of innocence in shadowy world, and a puzzle too hard for a novel mind to solve.

The first computer, if we might call it that, is as remote to a modern machine as it is distant in time, but it is there – in the abacus, a counting machine from 300 BC that we might find the root, the link of all future computers. That is all to say – that a computer counts and provides humans a means – to quantify. Until I get another breakthrough… check out this online abacus.


ktsmobil
2415
Services

Blog 7: Using Excel – Formatting Data Into Tables

Using Excel: How to Convert Data into Tables and Back!


Microsoft Excel, as part of the larger Microsoft Office suit is an excel business tool. In my work, I have found it effective for developing budgets, time, and labor estimations, and even some script-kiddie programming!  But today the topic is a simple how-to?

  1. Open Excel.

// If you’re using a Windows 10 OS Press [ Windows + R], this will open the Windows Run feature as possibly say you time! Once open type excel.exe to create a new instance.

  1. Press [Ctrl + S] to Title and Save the document, and then select a location on your laptop.

// Titling the document can be as simple or as complex as you’d like to make it but ensure that it reflects the data types included. For example, ‘1 Month Financial Budget’.

  1. Next, we title our headers. The documents will always open to field A1 and have a green box around it is indicating the ACTIVE field. Here we’re going to name this Budget Categories.
  2. Our next header will be place in B1 named Estimated Monthly Cost.
  3. With our headers completed we need to flesh out the footers with more strings, what sort of things do you spend money on broadly speaking? Food, Rent or Mortgage, Transportation, Utilities? It’s important to get the biggest expenses down first, for most people this is going to be just what I mentioned.

// Remember, if this is your first-time budgeting, estimations are a big part of the process – and that to make them accurate attention to detail, and even some external data sources, are necessary. With that let look at some statistics to get an idea for one volatile price-points, Food. Well Kept Wallet was my source document for the food estimate, of $405.30. I placed that in category B2.    Next, we need some data on Rent OR Mortgage, for someone with a Mortgage this value should be easily gotten. In my circumstance, Louisville Rent Café’ has generated an estimate of $1,034 per month, this is in B3!  That’s a lot of labor! Social studies aside, let’s enter the data.  Transportation, once locked in, is another large and static expense for most people – and if only I could have stopped myself in my mid 20s! This value varies from household to household, but AAA’s data suggest the price to be roughly $713 per month, that’s in B4! For a labor perspective, no wonder people are protesting about the cost-of-living! The last category we’re going to look at is Utilities, which in my mind are a combination of Electric, and Internet – some rental agreements will cover others such as garbage and water. Numbeo estimates this value to be $199.00, finally that’s in B5.

Once we have placed this semi-unformatted data down, we are going to add units of measurement as a nice table. For a table of this size, the sorting features of the table won’t be much help, but this is a beginner-level article!

  1. To place the data and its headers into a nice grouping, left click and select all the relevant cells.
  2. View the Styles Ribbon at the top of the document, and Select ‘Format as Tables’, select any design and then select OK.

// The last thing is to format the data in the ‘Estimated Monthly Cost’ column into currency.

  1. Again, select all relevant data with left click. This will be B2:B5.
  2. Right-click and select format cells. This will bring up a window titled ‘Format Cells’
  3. Select Currency and Select OK. The default is to show a two-point decimal for cents.


That’s it, you’ve successfully estimated and formatted the type and cost for a month of some bills! You may find that Tiller Money  is a good alternative, if you prefer to use pre-formatted masks – but there are some pros and cons with that system that I will discuss later.

The final quick thing to discuss is how to unformat this simple data.

  1. Right click any cell in the range
  2. Select Table in the drop-down
  3. Select Convert to Range
  4. Done!


Thanks for reading! If you’d like to discuss further technologist concepts shoot me an email!


ktsmobil
1
Services

Blog 6: How To Create Pie Charts In Microsoft Excel

Dealing with data, and visualizing that information is an important business skills. Today, I’m going to run you through the steps to turn an 2×8 range of data into a pie-chart.

Creating pie-chart reports in excel

0. Understand the purpose of this data. For me time, and money management are the biggest uses of excel – and since I cannot possibly remember
everything I did last week, I can use these visualization as a summary of where my time went.
1. Get data, excel wont work without lots of variable data. This could be as simple as the 8 numbers I’m using, or as complex as one several thousand
line data-set I found at Data.gov.  In this case, we’re going to use the simple summary of how much time I spent on a task.
2. Name the data, in programming this has been described as one of the most difficult tasks, but as they always use to tell me in the military –
K.I.S.S. – keep it simple. My first row will display the header category, and all the sub-categories under it.
3. Add a second column header name weekly time total, and insert the data.
4. Insert the value into each category, I  spend 10 minutes in cat 1, 5 minutes in cat 2, etc.
5. Once you have named and put value to you data-range we simply select the 2×8 range and mouse to the insert ribbon at the top.
6. With you range selected click the Pie-chart within the charts banner. Select your favorite illustration and done.
7. Enjoy your simple data visual with a cup of DeathWish Coffe!


ktsmobil
0
Services

Blog 5: How To Block Access To Explicit Adult Content

For parents, and family members alike – pornography has become more than a small water pipe. In fact, one report says that pornography makes up 30% of all data that is transferred across the public internet! Getting more visitors than, “Netflix, Amazon, and Twitter combined!” Well today I’m going to illustrate a simple and free method for blocking these sites. I’m also going to detail a work around, for the curious – and an additional layer of defense against these work arounds for security in depth.

Blocking Adult Content By Changing The DNS

In order to block this content we are going to update some DNS settings inside of the router.

1. Navigate to the routers’ GUI page using a web-browser. This information is typically 192.168.1.1, but may vary based on the router you’re using.
2. Login
3. Navigate to the DNS Settings. This is a (WAN) Wide Area network configuration, so it will be nested somewhere in that setting, but again you’ll need to look around. If you’re lucky your router will have a search bar to find it quickly!
4. Update the DNS settings with one of these IP addresses. These will typically be automatically assigned by the ISP, but in our case we have a list of 10 potential DNS Servers to choose from.

5 . Close save the setting change, and try navigating! It won’t work, but if it somehow does try a different DNS until you find one that works!

Work Around

The next thing, is how to get around this for the curious and quite possibly addicted! One way to view archived images  is by using The Way Back Machine. This is   Internet Archive’s web archive, launched in 1996. It contains over 2 petabytes of data compressed, or 150+ billion web captures, including content from every top-level domain, 200+ million web sites, and over 40 languages.

These images will continue to be content protected, and the one I visited had nothing other than static content. If you’re looking at this for a work around, you may need to implement a remote content filter. Stay tune for an update from the service provider on how to block the work around!? Perhaps blacklisting the way back engine itself is the solution?

Block The Work Around!

If you have any insights reach out at anthony@ktsmobile.net


ktsmobil
0
Services

Blog 4: How To Transfer Photos from iPhone To PC

How to import photos and videos from an iPhone to PC


It is a good storage practice to transfer the photos from your iPhone to the PC – failure to do so can really ruin a night out, and waste time trying to figure out what exactly to delete! You’ll need a lighting cable, your iPhone, and the PC you’re transferring the photos to.

  1. First, grab your Lightning USB cable and plug it into your iPhone.

  2. Plug the other end into the USB port on your Windows computer.

  3. Make sure your iPhone is on, and unlock it. Unlocking it allows the PC to find the device so you can start the transfer. You must allow the PC to access the phones file system.

  4. Once you allow the PC to connect to the iPhone, the PC should automatically open the Photo Application. If so, you can skip steps (5-7)

  5. Hit the Windows Icon button on your computer’s home screen

  6. Select Photos to open the Photos application.

  7. Look for Import and then select From a USB device.

  8. Follow the instructions on-screen and select the photos you want to import.

  9. Select the delete original items after import box.

  10. Choose where on your PC you would like the photos to be saved.  By default, they are generally saved to your Photos folder.

  11. Allow the import a few moments to finish.

  12. You should see a prompt indicating that your file transfer was complete.

  13. It’s now safe for you to disconnect your iPhone from your computer.

We made some slight modifications to the sequence, and optimized the instructions exclusively for iPhone! Our inspiration was found over at UBreakIFix.com

ktsmobil
0
Services

Blog 3: The Wireless Access Point

Ah – the WAP! This ubiquitous device is crawling through just about every home in America, with reports indicating an astonishing 76% of people using a wireless router as their primary connection device. This technology has some great benefits, as the name would indicate it’s well…wireless, and clean, but – there are some fundamental issues especially in bigger home that can lead people to call their I.S.P. as say “my wireless is slow”.

That’s where KTS comes in, with our skilled team we can blow those speeds out, like lights on a Christmas tree, throughout your home! Contact us to find out how.


# Services!

ktsmobil
13
Services

Blog 2: The One-Dollar Stock Challenge #2

After the first week using this portfolio, I have a regrettable report. That the evaluation of my portfolio, has lost value in comparison to my starting investment! While all of the share are trending upwards at the close of the day, the overall position of all 3 is lower than the summary position on initial investment.

An interesting thought was that the portfolio was up .05 cent in value on August 6th. Had I been able to see this and sell I’d have made that as a return. Can RobinHood(r) be set up to run an automated sell? While I cannot enable this programmatically, perhaps we ought to revise our 3 fundamental shares using the below “Most Anticipated Earning Releases”?


# Money Management # Investment # Automation

ktsmobil
0
Services

Blog 1: The One-Dollar Stock Challenge #1

The One Dollar Stock Share Challenge

Today we’re going to discuss Robinhood. It’s been all over Facebook feeds, and some people have claimed to have made tremendous amounts of money, but pending another bubble – the question is how can you position the money you NOW have to bring you sustainable and honest returns?

As a technologist, my interest begins and ends – almost exclusively in that domain, and as you are exploring what’s being sold through Robinhood, the list feature will be a great way to outline any potential purchases.  Depending on your workforce – it’s going to take some discipline to avoid adding an unmanageable number of potential investments to your listing.  Because of that tendency, I am going to limit myself to 3 one-dollar shares, in a large, medium, and small sized company.  

As you begin to think these things through however, you quickly realize that difficulty in measuring this. What is to be considered a “large amount” of employees, or “medium”, or “small”?  Working from my base with Charter-Spectrum, the cut-off for a large company is going to be 95,000 employees. We will half split that and define medium to be 47,500 – and finally a small company to be 23,750.

Now, one problem I am facing is that there doesn’t seem to be a built-in feature on Robinhood to facilitate this type of research. Perhaps that will be coming? Though, continuing with this metric, is quite difficult Robinhood has curated a Technology-based Trending List – which can be filter based on market caps instead.  

It seems to stand to reason that a company with a smaller market cap would have fewer employees, so we will now add this variable to our search.  Its worth noting that the trending technology page has filters beyond the Market Cap that would prove useful, but that will not be covered today.

As I am indexing this trending list, it’s worth mentioning that my eye is drawn to companies I seen market often, and it is for this reason that in spot number 3, I’ve chosen Vizio – and after researching the company, see that it only has registered 500 employees! This company must be very I.P. focused!

Now, in this middle range – there are some creative sparks flying! I have sort of max out a min-max, but the middle range, much like a Venn Diagram, may be best understood as a “connective zone”. Where I ask the question, how are or how can these two entities be connected? Ideally, that’s where K.T.S. will come into play in coming years, but for now only public entities are even tradeable!

So then, we look at what each company offers. 1. Charter Spectrum is a national ISP delivering Television, Internet, and Voice services to it customers. 3. Vizio, specializes in “It engages in deriving the future of televisions through its integrated platform of cutting-edge Smart TVs and powerful SmartCast operating system.” What links these two domains? That is where Southern Copper comes it! While there may be many, many potential links – perhaps the most ubiquitous answer is material, and that material is copper. It’s use in every inch of cable networks, and is a fundamental component of all electronic systems.

After some reflection, it did seem that with Charter Spectrums’ wireless streaming services being limited to specific television brands, primarily and to the best of my knowledge, allowing their users to operate the Spectrum Television App exclusively on Samsung Smart TVs. The unfortunate part about this was that Robinhood does not have any listing for this company – alas, by the time these sorts of things align their policy may have already changed, and who knows when that information will be widely known! 

In summary, we didn’t meet our goal of purchasing a whole value share for $1.00 but, we ended up with 3 strategically aligned partial shares – the next question is how can we impact them with such a small portion in each company? I’m having thoughts on automation…


ktsmobil
0
Services

Blog 0: The Network OR The Equipment

Scope / Outline:

  1. Introduction: The Network or The Equipment
  2. Key terms
  3. Troubleshooting Theory
  4. Pseudo-code
  5. Network Testing by Gathering Data
  6. Sub-Modules Compared, Foot-printing HOST Machines.
  7. Central Processing Unit
  8. RAM
  9. O.S.
  10. Router
  11. NIC
  12. NIC firmware and drivers
  13. Conclusions and Lessons Learned

X. Illustrations, Graphs, Etc.

XII. Discarded Edits, Further Blogs, Incubation XIII. Uniform Resource Locators

XIV. Questions

Introduction AND Scope

The purpose of this blog post is to further my tactical skill-set development, and upon successful completion will serve as proof that I have gained the skills needed to effectively troubleshoot, find, and fix problems within a simple residential network: its access point, and host machines. In a broader sense, the goal is to demonstrate that these skills can be fielded in a serviceable environment, mainly that my company Kornrumpf Technology can provide its primary economic service of “trouble-shooting and optimizing residential networks.” This troubleshooting and optimization will follow two potential lines, the first being within Wireless LAN networks and their endpoints, the second being within the wired ethernet protocol and its associated endpoints.

As a more theoretical proof of competence, this blog post seeks to demonstrate and understand fundamental computer processing network theories of operation and their associated problems – using various tools & utilities for measurements and exposition. The primary model being referenced is the OSI model, and I will attempt to structure my understanding of it as a guide for identify processing and throughput errors. This proof hopes to be open to and supported by conclusive peer and mentor review based on repeatable data – and these solutions once understood and documented will act as a body of knowledge and evidence to support future troubleshooting and optimizing of residential networks. With that, let us begin our troubleshooting with our Wireless LAN and end-point scenario. Our client calls because of poor network speeds … it is from this point that we begin to gather data and ask questions which will lead us to our final determination, namely who or what is to blame for the error? It is in the spirit of that question which, this article is titled that we begin: ‘Is this problem a network failure or on the clients host equipment?’

Key Terms

Note: This index is NOT comprehensive, and after concluding on the error – I will attempt to highlight the most important terms.

1. Signal Bandwidth, band-width – The range of consecutive frequencies. Bandwidths exist in the context of both signal processing and network computing. Where the ‘given’ path is the signal frequency bandwidth and the maximum data rate is the network bandwidth capacity.

1a. Downstream Channels – The signal bandwidth frequencies are separated into 6 MHz bandwidths over which binary data is downloaded to endpoints.

1b. Upstream Channels – The signal bandwidth frequencies are separated into 6 MHz bandwidth over which binary data is uploaded to end-points.

2. Network Bandwidth Capacity,

This term is a measurement of link throughput, and results can be found using remote Speed Test servers. This capacity is affected by WAN ISP provisioning and limitation.

3. Network Latency,

This term is tied to measurement of the delays experienced by a single packet traveling through a network link, between host and server. For example, The Network Bandwidth Capacity may be clocked at 200 Mbps / 10 Mbps but the latency of each path in the link can cause delays in the resource being given to the end user.

4. Jitter,

This is a comparative test between multiple packets. Whereas latency is a measurement of a single packet, jitter will compare the intended packet sequence with what is received. For example, the host sends 3 ICPM Packets to a server using ping. Each packet will have a slightly different initiation-response travel time, and packet A and C both route in 10 MS, but packet B routes in 100 MS, this indicates a problem.

5. Central Processing Unit,

This module carries out three primary operations: fetching – which is to receive instruction from memory, decoding – is the conversion of these instructions into machine language, and executing – which is the transmission of decoded instructions to other components in the system.

6. Random Access Memory – This hardware temporarily stores and transmits programed instructions from applications and programs. The quality of this component is measured by how much binary state data it can store, and how quickly the data can be read by or written to the machine’s processors.

7. Operating System, a programed abstraction layer which manages the I/O processors of all system hardware components.

8. Router,

A fundamental networking machine responsible for routing fully formed packets across networks of variable sizes.

9. Network Interface Controller,

Operating at a lower-level in comparison to a router – this packet encoding, and decoding component transmits I/O data to and from an external host – in combination with built-in drivers, their associated firmware, the host machines operating system, and processor.

10. Pseudo-code,

English-like syntax that represents a programming language, using concepts such as – functions (verbs, actions, specific steps), conditions (branches, forks-in-the-road), Boolean expressions (a question with a yes or no, true / false, 1 / 0), and loops.

Troubleshooting Theory

Troubleshooting any system is rooted in a remarkably simple statement: ‘this does not work.’ But with computers and their networks, this comes with several layers of encapsulation and interconnected modules, each of which demands clearly defined boundaries, and purposes. From there, finding and fixing what does not work requires a systemic series of steps intended to isolate, identify and ‘make it work’. Troubleshooting is fundamentally a scientific methodology, which means – to observe the system state, propose an initial root cause, design an environment in which this first cause can be tested and measured, and then determine if your theory or thesis was true. In keeping with the nature of computer science, we will begin with a logical attempt to “observe the system state” using pseudo-code. Rather than simply stating the system is not working, it will start to introduce some variables for measurement and experiment purposes. As Mark Zuckerberg says, “if you can’t measure it – it can’t be improved.” Beyond that – we are going to use some other tools to effectively communicate our thesis and results. These conclusions will contribute to further observation, and an understanding of fundamental computer science abstractions such as the OSI Model.

Module 3A. Pseudo-code

The Sub-heading titled: X. Charts, Screenshots, Illustrations, Graphs, Etc. contains shows a few examples of attempted pseudo-code. While I have attempted to encoded functions in blue, conditions in orange, Boolean expressions in green, and loops in brown, this system has not found its way into a living language understood by a complier yet, and therefore is NOT executable. However, the why or purpose of the code, is this – each is attempting to: identify and declare the state of the computer-systems’ modules , test their variable working percentage-capacity ( // NOTE: this can be understood as data or information gathering) – and then it proposes a solution through either an exchange or repair of the module, finalized by a loopback with another test of the working percentage.

These codes are elaborated AND explored further in a future blog post – and game.

Module 3B. Network Testing by Gathering Data

Using the pseudo-code as our guide, we must define what a non-functioning module looks like. This code is extremely sensitive, requiring a 100% operating efficiency, but let us begin by gathering data to determine if that fact is true or false. The most accessible means of doing this testing is using a pre-programmed GUI that will demonstrate the problem – this can be accomplish either online using Ookla AND navigating to the test OR through their desktop application, which is said to have better accuracy AND perhaps to be more efficient.

// NOTE : For the data to be homogenous the test-server should be the same throughout, and a balanced time throughout the day.

As you can see, in the image below, that there is clear visual evidence that Module A is functioning improperly or according to our pseudo-code ‘If (Module A < 100 %) {swap Sub-Module A1). Next, we need to go into detail about these Sub-Modules, and their operating efficiency. That is the next portion of our code, which requires a loopback. The module elaboration and enumeration for this test host can be found in the illustrations heading as well. The sub-module section next will also elaborate.

Sub-Modules Compared, Theory & Foot-printing HOST Machines.

// NOTE: The Sub-modules order by precedency and assumed dependencies, but that is up for debate.

// NOTE: The exploration of these modules has been reduced for brevity after the root-problem was identified to be the NIC.

// NOTE: A previously well defined table failed to import, and the enumeration would risk the users machine integrity.

Module 4A. Processor Point of View

Like the firmware, programming a processor is beyond my current skill set, and though these modules can be upgraded as well, laptops are much less accessible to upgrade due to their design. Based on results from activity monitoring, the processor is the least likely problem associated with throughput, however – it does make sense, that in an administrated environment, a remote server could much more quickly processed and transmitted the payload of information – ahead of the host machine requesting the information, effectively creating bottlenecks.

Note: The most advanced means of communicating with the processor is going to be via the use of a complier, however – my experience has limited me mostly to command prompts. I’ve inserted a brief video where a command prompt is next to the .NET editor for comparison. Both appears to be consoles, but with vastly different capacities. It appears the .NET editor gives a more fundamental point of view to the processor, but that the command prompt gives more ability to monitor and test the system.

Module 4B. Random Access Memory Point of View

In the process of testing for network throughput, I have also determined that this machine has quite a small amount of memory installed, and so it is common for the activity monitor tool to show a high amount of memory pressure. However, by installing a smaller OS, we can reduce some of the Wired-system memory, additionally testing some memory monitoring software may prove useful. Memory Cleaner also provides a percentage view of current memory usage, easily visible from the tray, with the ability to [Cleanup] unused processes.

A final optimization involves the browser application, where one such as Opera offers the smallest memory demands, in fact – much smaller than default browsers such as Chrome! Further details about the internals of Machine can be found in the [About this Mac] tab.

Module 4C. Operating System Point of View

While it is unknown to what degree the OS, much like firmware, and memory – will affect network throughputs – it is already observed that different Operating Systems have different system requirements to function.

Module 4D. Router Point of View

After updating to MacOS 10.14.16 and re-running the network test – the results continue to remain below 100 Mbps. We are going to purchase an external NIC, the Foktech dual band wireless adapter. Unfortunately, this new Ext adapter still is not showing my full throughput… though there were moments that showed over 150 Mbps and on top of the proxy-type error, there is now a socket-type error. It is possible that over-crowded channels and an incorrect broadcast mode from the router which limits bandwidth?

I did discover that the default broadcast mode for the router is 802.11ac, with options for 802.11n, and a combination of 802.11 n & 802.11 ac. Though this could be inaccurate because even after a restart the AP did not dump all configurations. (configuration path: 192.168.1.1. | Admin console | Wireless) For some reason my built-in NIC is not working properly? Once again, the NIC card throttles bandwidth up-to 150 and back down. I am attempting to collect historical data in Ookla. The network also appears good on the second and third test devices. Note: There is a lack of uniformity in the test servers being pulled off. In fact, I have seen downloads as high as 200 Mbps, but a subsequent failed upload.

Module 4E. NIC Point of View

// NOTE: While in summary, the built-in NIC was Identified as the source of the network speed problem, the lessons learned from exploring each module remain valuable.

The primary means for analyzing the network link will be to by using Ookla Speed Testing (Image 5A1-1 and 5A1-2). The card itself supports the 802.11 a,b,g modes – and when functioning properly this 802.11 Wi-Fi standard – “Approved in 2009, (and is describes as) Wi-Fi 4th Generation enables speeds of 300 Mbps.” However, 4b-1 show results that prove Module A is NOT functioning properly. Further tests using the same network, but a different host also serve to prove that the issue is in fact NOT the network link. However, this is the limit of my diagnostic ability of Module A1.

A secondary test, and a potential tool – pending further elaboration, is to ping the internal loopback address at 127.0.0.1, using the terminal window. A failure of this would indicate that card itself is non-functioning, but it provides little insight on the quality of the link. Again, we need the results from Ookla, is prove that the external throughput is only working at a 30% operating capacity. See Illustration.

Knowing that the NIC is working in a limited capacity, the next step is to swap the module. I have purchased a Forkteck External USB Wi-Fi Adapter, which supports multiple 802.11 PHY modes. This includes modes: a / ac / b / g / n. Directly from the manufacture, this device is plug-and-play, with little adjustment requires, but after an initial test the card continued to fail throughput. From here, I was necessary to review some of the internal router settings, at the router’s loopback address 192.168.1.1. After adjusting the 5 GHz bandwidth broadcast mode to PHY mode ac… SUCCESS – the provisioned throughput from the ISP worked!

Module 4Ei. NIC Firmware AND Driver Point of View

While this will play a role in further software development, my knowledge on this topic is limited, and I would have no capacity to troubleshoot this – beyond updating the modules to their latest version.

Conclusions and Lessons Learned

The conclusion of this paper and testing has been to show through external NIC card testing the root problem to be somewhere in the built-in NIC Module. Further The resolution to poor network performance was to replace the current Wi-Fi card with an updated 802.11 card, and to change the broadcast mode of the WAP. However, from a business administrative point of view – I would have no further methods for testing or repairing this failing component, which was causing users to experience multiple dropped URL requests, and slow web-page load response time. However, I have failed to draw many 1-to-1 relationships between the OSI Models and this particular network problem, but – I can condense that the errors are limited to the physical and data-link layers alone. There is a further issue of data security and resource stability that I need to explore AND will continue to in further posts.

// NOTE: Some modules have been removed and are pending further elaboration and development.

X Charts, Screenshots, Illustrations, Graphs, Etc.

Code Snippet 4a-1

// NOTE: The swap function will be executed if the specified condition is true. i.e., Module A, B, C, etc. is > 100 %.

// NOTE: Modules / Procedures / Methods and it accomplished something – are functions in themselves, each programming language has (sequence structures, repeat (loops) until conditions, selection structure (paths).

Example 1:

If (Module A [1,2,3,4,5,6,7,8] is NOT functioning)

// [This statement is also a Boolean expression – where functioning or not functioning is the binary state ]

Then {swap Module B [1,2,3,4,5,6,7,8]}

//NOTE: Example 1 is missing a loop.

Example 2:

If (Module A is < 100 %)

Then {swap Module B} 

Example 3:

If (Module A is < 100 %)

then {swap Module A1, A2, A3, A4, A5, A6, A7, A8}   

Example 4

If Mod A < 100  

Then {swap Sub-Mod A1}

Test network speeds on domain @ standard server and time

Loop-back to line one?

If Mod A = 100  

Then STOP

Example 5

If Mod A < 100  

Then [Console.WriteLine(“Andrew, Sub-Mod A1 has been inserted in place of Mod A””;]

Test network speeds on domain @ standard server and time

Loop-back to line one?

If Mod A = 100  

Then STOP

Example 5a

If Mod A < 100  

Then {swap Sub-Mod A1}

Test network speeds on domain @ standard server and time

Loop-back to line one?

If Mod A = 100  

Then STOP

XII. Uniform Resources Locators

1. https://research.ijcaonline.org/volume78/number1/pxc3891071.pdf

2. https://editor.wix.com/html/editor/web/renderer/edit/a03ca54b-136d-4fca-b505-76d07f7072c5?metaSiteId=dbcd6f02-0744-4a94-865e-1afb50377a73&editorSessionId=cd8fd209-e722-453b-82b4-4220cfcdcd8c&referralInfo=my-account

3. https://www.semanticscholar.org/

4. https://en.wikipedia.org/wiki/Proxy_server

5. https://www.speedtest.net/insights/blog/maximized-speed-non-gigabit-internet-connection/

6. https://images.globalknowledge.com/wwwimages/whitepaperpdf/the-skills-development-index-white-paper-global-knowledge-us-en.pdf

7. https://www.wireshark.org/download.html

8. https://en.wikipedia.org/wiki/Network_interface_controller

9. https://superuser.com/questions/450255/no-response-when-i-ping-my-website-but-i-can-still-access-it/450256

10. https://www.macworld.co.uk/how-to/record-screen-mac-3527168/

11. the-skills-development-index-white-paper-global-knowledge-us-en.pdf

12. https://support.apple.com/guide/system-information/get-system-information-syspr35536/mac

13. https://www.amazon.com/gp/product/B08LG9TYC9/ref=ppx_yo_dt_b_asin_title_o00_s00?ie=UTF8&psc=1

Questions:

a. Where does signal bandwidth meet the maximum rate of data transfer across a given path?

b. Why then is my surfing experience characterized by dropped information requests: broken link, missing images, prompts to change to slower view? There are many other factors which add “considerable overhead.

c. How does a Browser request webpage?

d. Where does each user tool operate in a developer stack?

e. https://www.tutorialspoint.com/operating_system/os_overview.htm

f. How to overcome the limitations of pseudo-code? In particular, the little interaction with the processor or a language. Though some of the utilities and tools that will be used have their own code which may be integrated later g. How many OS can one machine hold? (https://setapp.com/lifestyle/macos-catalina-vs-mojave) https://techspirited.com/different-types-of-operating-systems h. Interesting thought: How do bind both adapters together? (Re-integrate #RN and Then Review Learning Commons for research assistance)

i. What is causing so many dropped request, even with a full throughput, low ping, and low jitter?

j. At what point does a voltage become a packet?

ktsmobil
0
  • 1
  • 2
  • 3
  • 4
Oswald WordPress Theme